
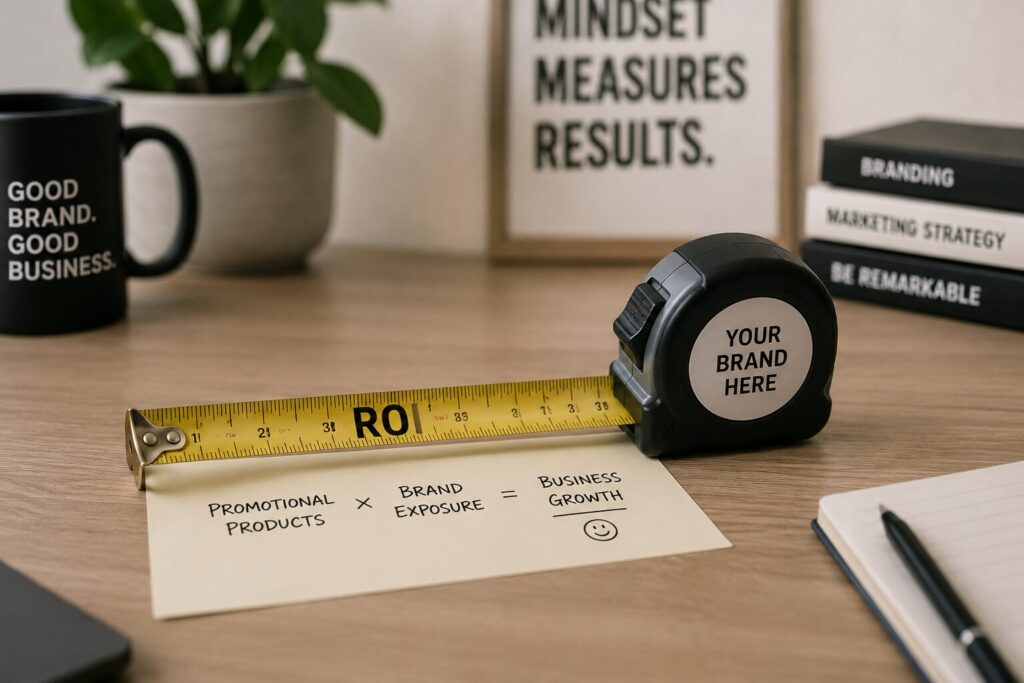
Three metrics answer most of what finance wants to know about merch spend: cost-per-impression, retention rate, and cost-per-engagement. Cost-per-impression tells you what each brand exposure costs over the item’s lifetime. Retention rate tells you whether that lifetime is realistic or wishful thinking. Cost-per-engagement tells you what happened at the event itself, separate from anything that happens afterward. Used together, they turn a merch line item into something a CFO can actually evaluate.
Why “we handed out 500 tote bags” doesn’t hold up
Marketing teams are under more pressure than ever to prove event and merch spend earns its place in the budget, and struggling to do so. A 2026 B2B events survey by Vendelux found 98 percent of teams struggle to justify event spend to leadership, and 86 percent cannot accurately attribute ROI back to events at all. Merch usually sits inside that same reporting gap. A quantity and a vague sense of “brand awareness” is not a business case. It is an activity list, and activity lists are the first thing cut when budgets tighten.
The good news is that promotional merchandise has better underlying data behind it than most other line items in an event budget. It just rarely gets pulled into the conversation with finance in a useful format.
Cost-per-impression: the baseline number
This is the metric the promotional products industry has measured most rigorously, and it holds up well against other channels. According to the 2026 ASI Global Advertising Impressions Study, based on surveys of nearly 5,000 consumers, promotional products deliver impressions at an average cost of six-tenths of a cent, and outrank both television and digital advertising as consumers’ preferred ad channel. At the category level, a six dollar tote bag generates close to five thousand impressions over its lifetime for a cost-per-impression of about a tenth of a cent, while a thirteen dollar cap comes in at around three-tenths of a cent.
The calculation itself is simple: total landed cost of the item, divided by expected lifetime impressions, multiplied by a thousand to get a standard CPM figure that finance teams are already used to seeing for other ad channels. The part that takes judgement is the impressions estimate, which is where retention rate comes in.
Retention rate: what actually drives the impressions number
Cost-per-impression is only as reliable as the assumption behind lifetime impressions, and that assumption comes almost entirely from how long the item stays in use. Industry-wide, 63 percent of people keep promotional products for more than a year, but that average hides a wide spread. A flimsy pen might get used once and binned within a week. A well made jacket or a quality notebook can stay in daily rotation for years, generating impressions the whole time.
This is why a defensible ROI model uses a range rather than a single number. A useful approach is to build three scenarios for any given item: a conservative case assuming short retention and low reuse, a likely case based on typical retention for that product category, and an aggressive case for genuinely premium, high-use items. Comparing cost-per-impression across all three gives finance a realistic range instead of a single optimistic figure that falls apart under scrutiny.
Cost-per-engagement: the metric specific to events
Cost-per-impression measures what happens after someone walks away with an item. Cost-per-engagement measures what happened at the event itself, before that. This is booth visits, conversations started, sign-ups collected, or leads captured per dollar spent on merch and activation, and it is a genuinely different question from lifetime brand exposure. An item can perform brilliantly on cost-per-impression over the following year while contributing very little to on-the-day engagement, and vice versa. Reporting both, rather than treating them as interchangeable, is what separates a rigorous merch ROI case from a hand-wavy one.
The wider events industry is grappling with a version of this same problem at a bigger scale. A 2026 Vendelux survey found that CFOs have largely stopped accepting brand-impressions metrics on their own for event programs and are asking for harder proof that spend connects to a measurable outcome. Merch sits inside that same expectation now. Impressions data makes a good starting point, but pairing it with what actually happened on the day makes the case far stronger.
A simple framework for a budget conversation
Three steps make this presentable to someone outside marketing:
First, establish landed cost per unit, including decoration, freight, and any duty, not just the base unit price. Second, apply a conservative, likely, and aggressive lifetime impressions estimate for the product category, and calculate cost-per-impression for each. Third, separately track whatever on-the-day engagement metric applies, whether that is booth traffic, sign-ups, or conversations, and report it as its own line rather than folding it into the impressions number.
Presented this way, merch stops reading as a discretionary extra and starts reading as a channel with its own defensible numbers, comparable to any other line in the marketing budget.
The bottom line
The data to justify merch spend already exists at an industry level. The gap is usually in translation, not in the underlying case. Building a simple range-based model, keeping impressions and on-the-day engagement as separate metrics, and presenting both with the same rigour finance expects from any other channel is enough to turn “we handed out 500 tote bags” into a number someone in finance will actually sign off on.
Sources referenced: the 2026 ASI Global Advertising Impressions Study, GiftAFeeling’s 2026 promotional product statistics roundup, and Vendelux’s 2026 B2B Events Survey.

